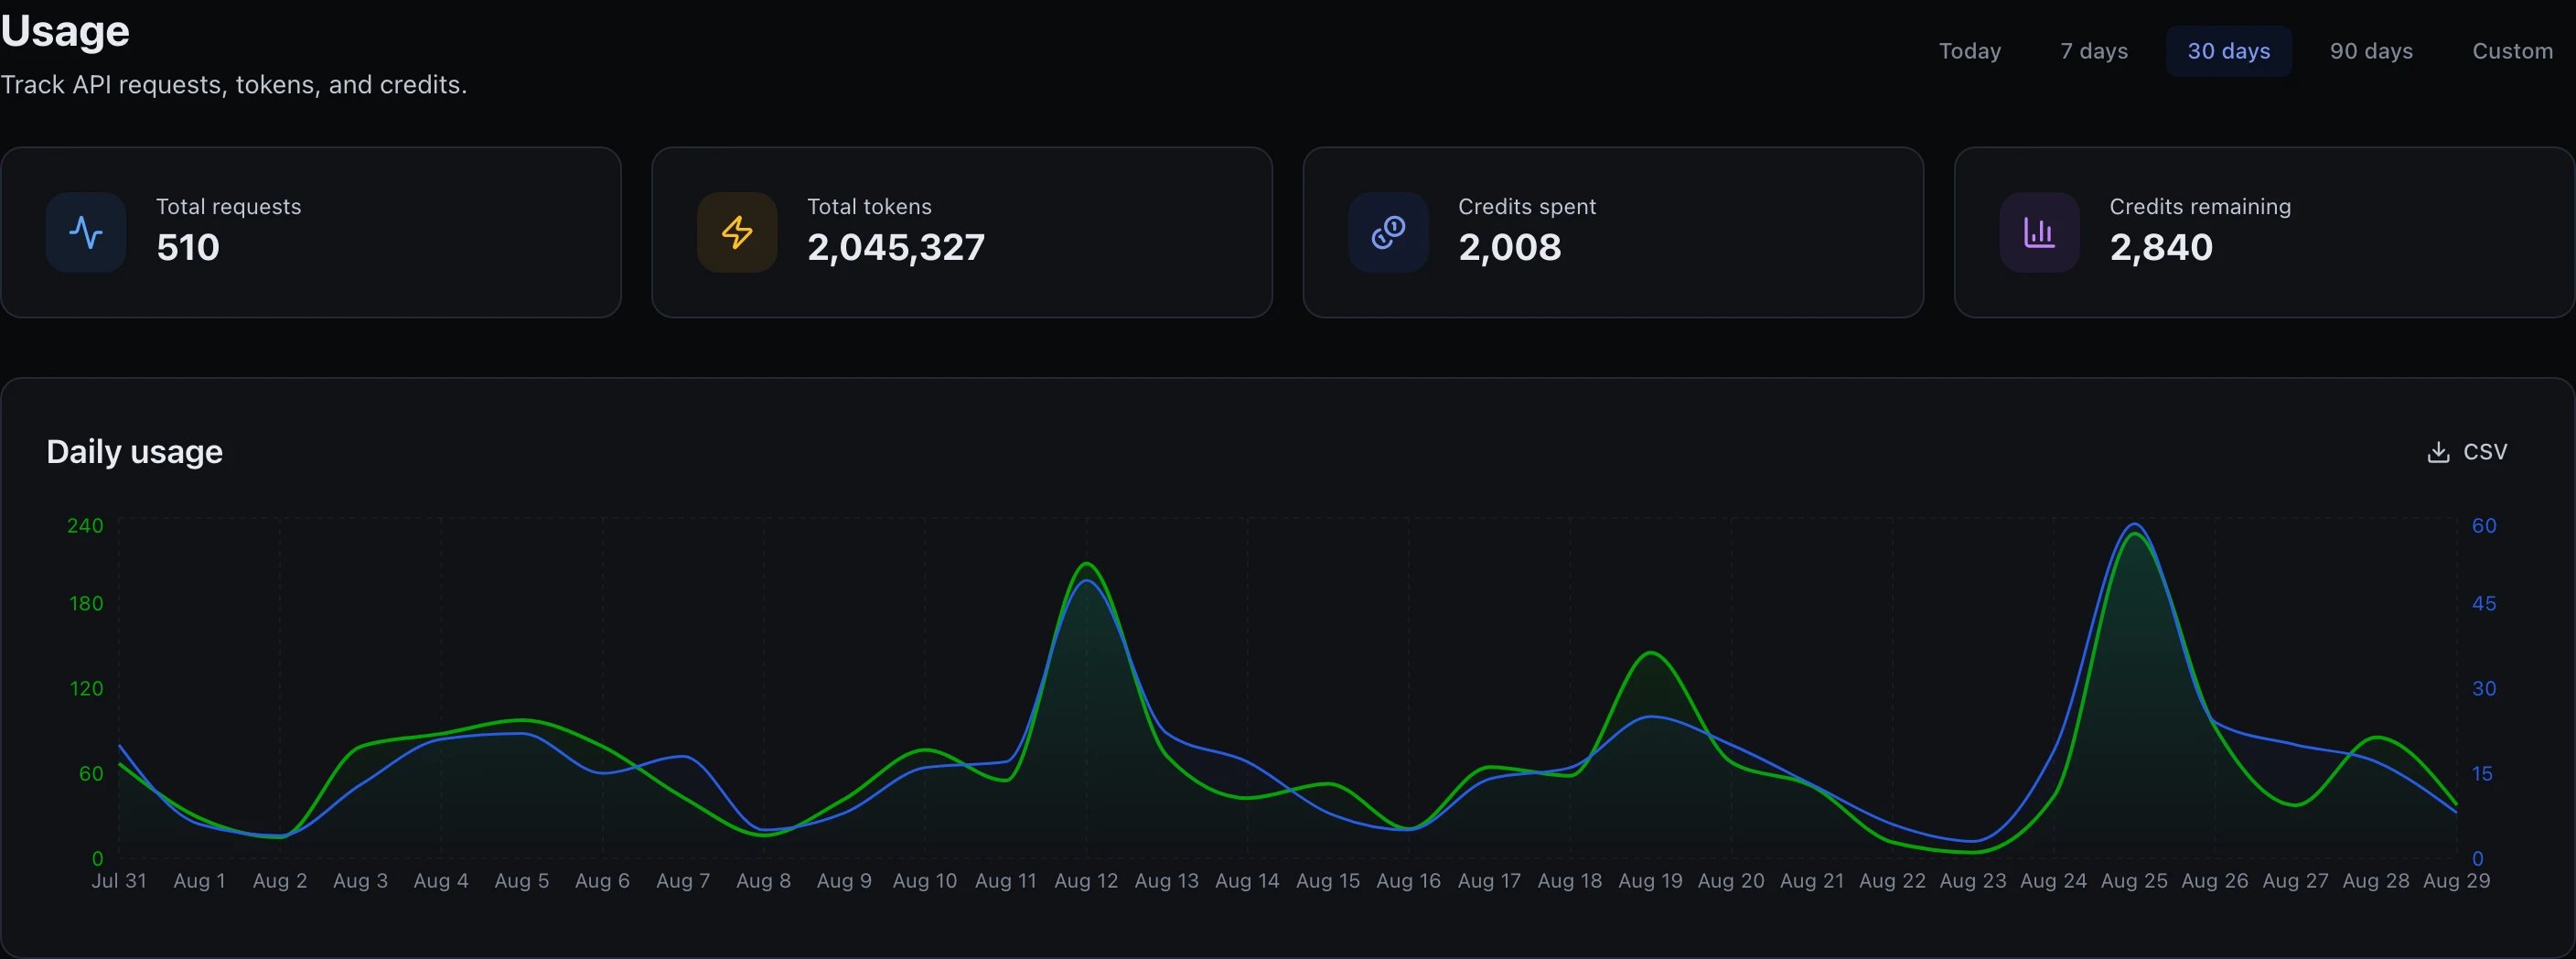
Every request — Studio or API — is metered the moment it completes. You can break that data down in the dashboard or pull it out via API for your own BI.

Where to look

Usage (main navigation) has four views: All charts respect the date range picker (today, 7 days, 30 days, 90 days, custom).

Drilling into a single request
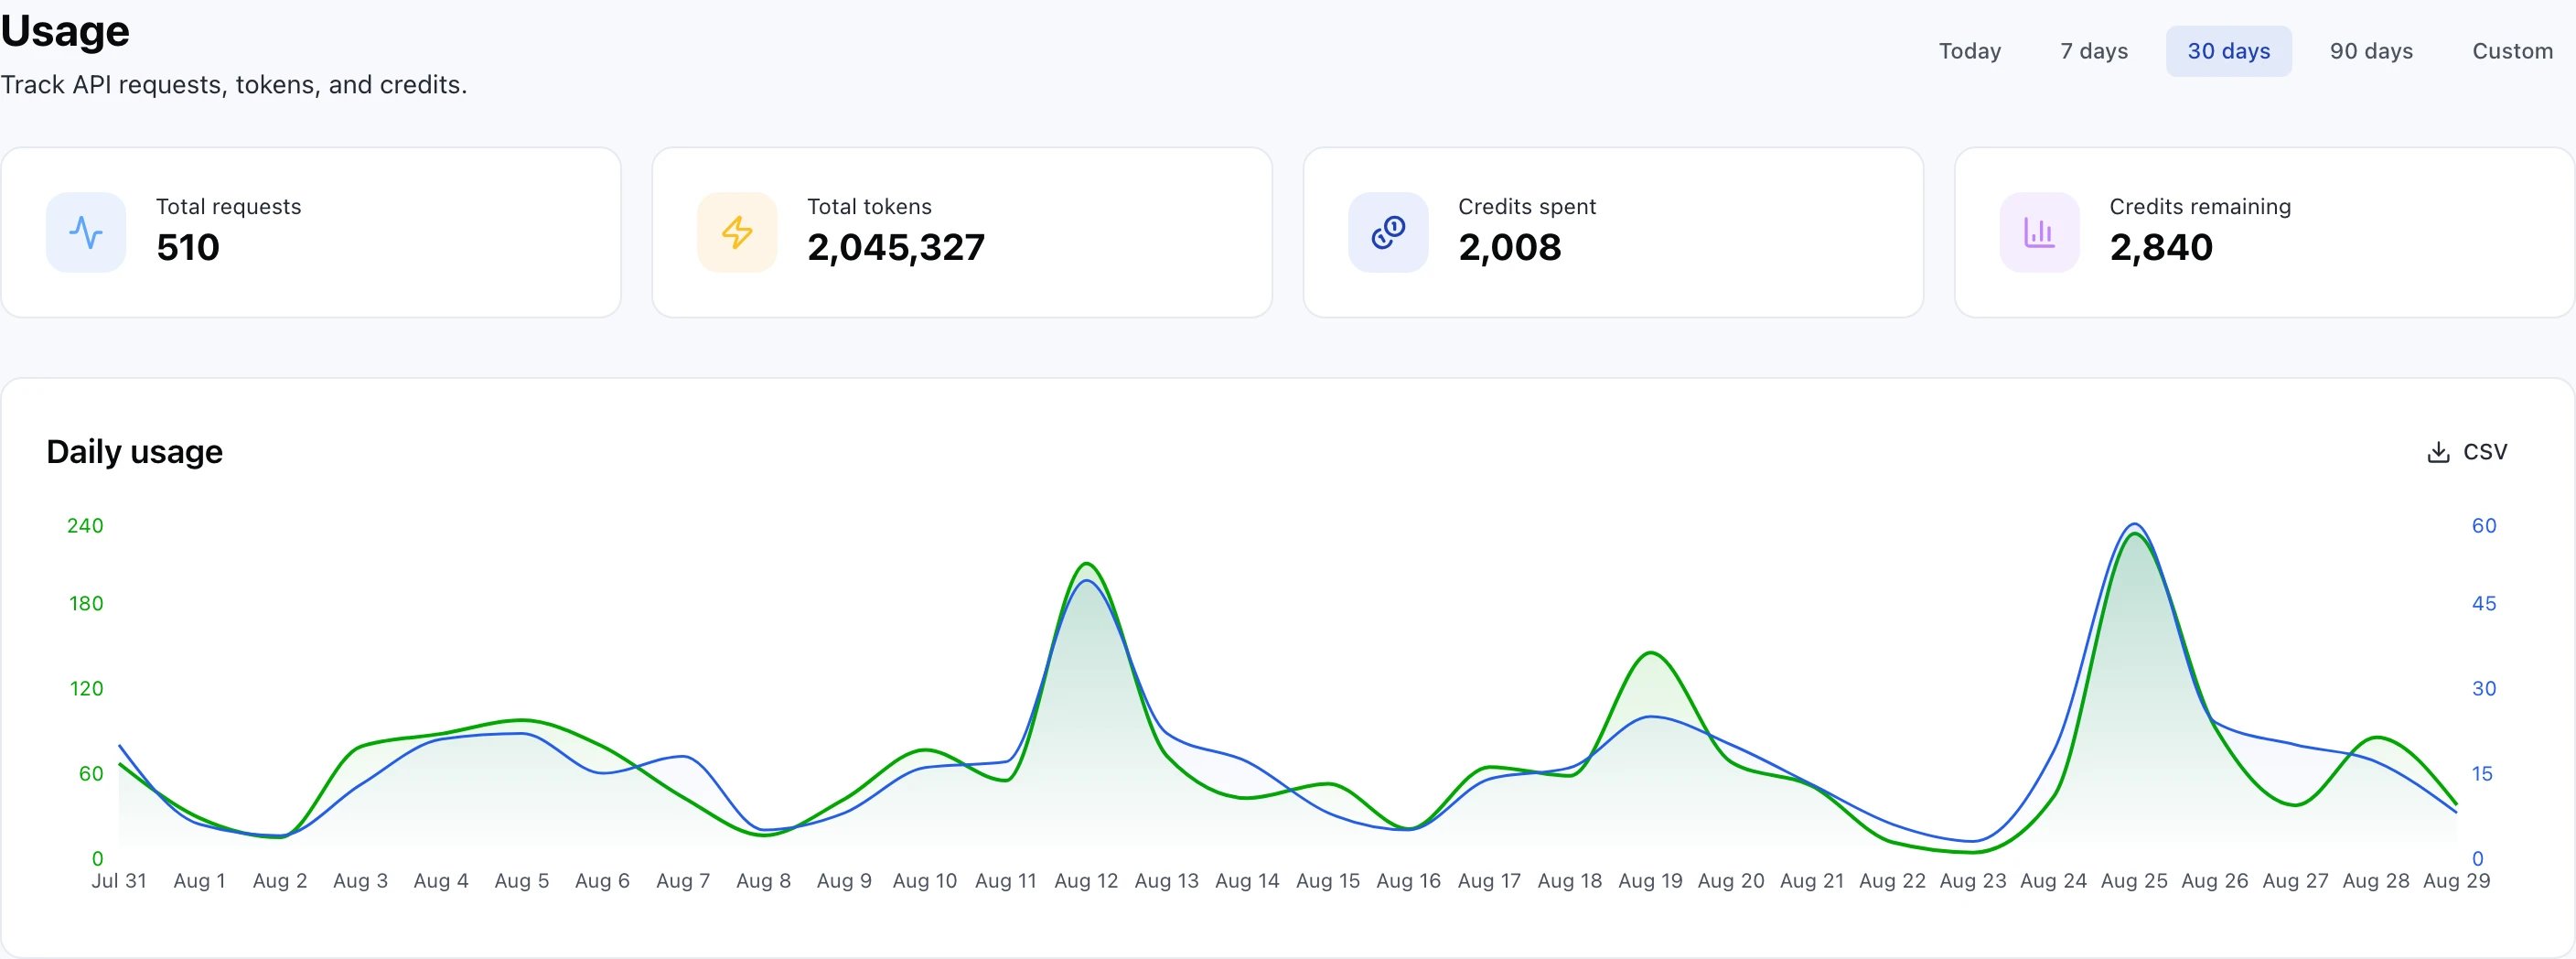
A Usage page headed Track API requests, tokens and credits, with Today, 7 days, 30 days, 90 days and Custom range buttons and 30 days selected. Four cards read Total requests 510, Total tokens 2,045,327, Credits spent 2,008 and Credits remaining 2,840. Below them a Daily usage area chart across the 30 days, plotting two series on their own axes: a blue Requests line (right axis, 0 to 60) and a green Credits line (left axis, 0 to 240) that closely track each other, both peaking on the same three days (around Aug 12, Aug 19 and most sharply Aug 25 — the single highest day in the window, 59 requests and 229.004182 credits).A Usage page headed Track API requests, tokens and credits, with Today, 7 days, 30 days, 90 days and Custom range buttons and 30 days selected. Four cards read Total requests 510, Total tokens 2,045,327, Credits spent 2,008 and Credits remaining 2,840. Below them a Daily usage area chart across the 30 days, plotting two series on their own axes: a blue Requests line (right axis, 0 to 60) and a green Credits line (left axis, 0 to 240) that closely track each other, both peaking on the same three days (around Aug 12, Aug 19 and most sharply Aug 25 — the single highest day in the window, 59 requests and 229.004182 credits).

The usage overview: totals for the window, and the daily shape of it

Every panel below the chart answers “where did it go” from a different angle, and each exports its own CSV.
A By model table with columns Model, Requests, Input tokens, Output tokens and Credits, listing exactly three rows for the window — GPT-5.5 (208 requests, 1382.478 credits), Seedream 4 (97 requests, 363.75 credits) and Claude Opus 4.7 (205 requests, 261.872 credits) — sorted with the most expensive first.A By model table with columns Model, Requests, Input tokens, Output tokens and Credits, listing exactly three rows for the window — GPT-5.5 (208 requests, 1382.478 credits), Seedream 4 (97 requests, 363.75 credits) and Claude Opus 4.7 (205 requests, 261.872 credits) — sorted with the most expensive first.

By model — where the credits actually went
Note that requests and credits do not rank the same way. In that table the 97-request image model (Seedream 4) costs 363.75 credits while the 205-request text model (Claude Opus 4.7) costs only 261.872 — which is the whole reason this panel is by credits rather than by count.
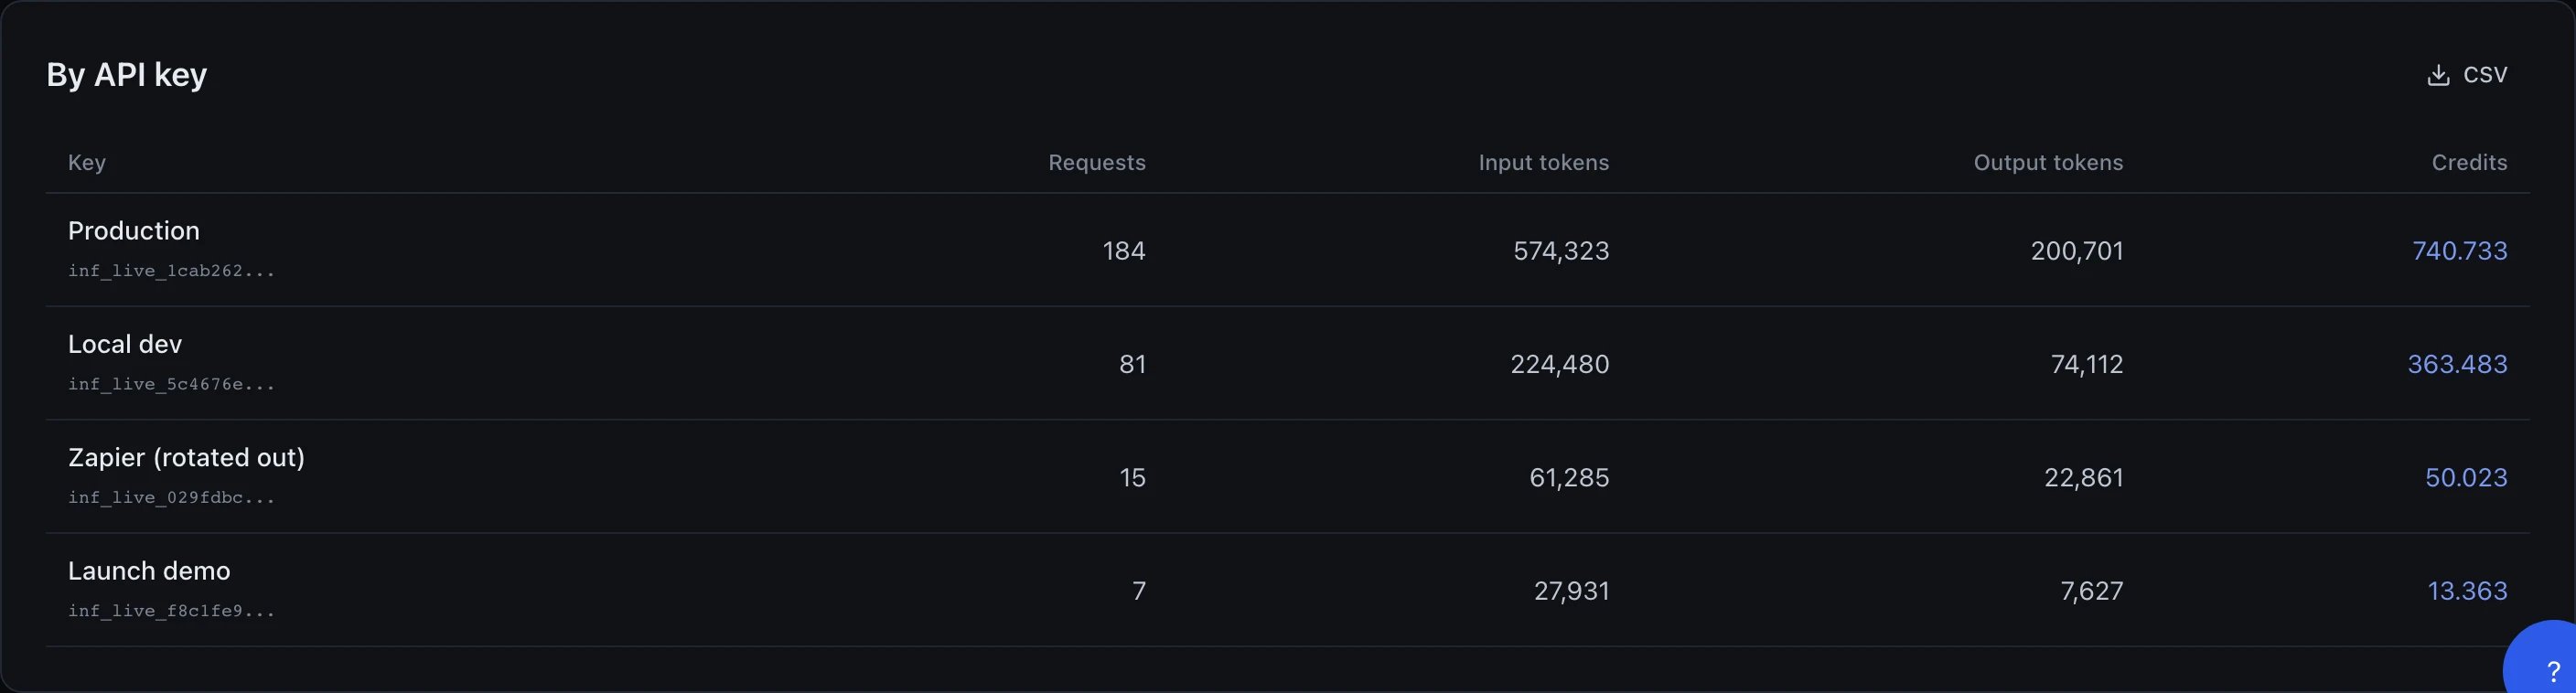
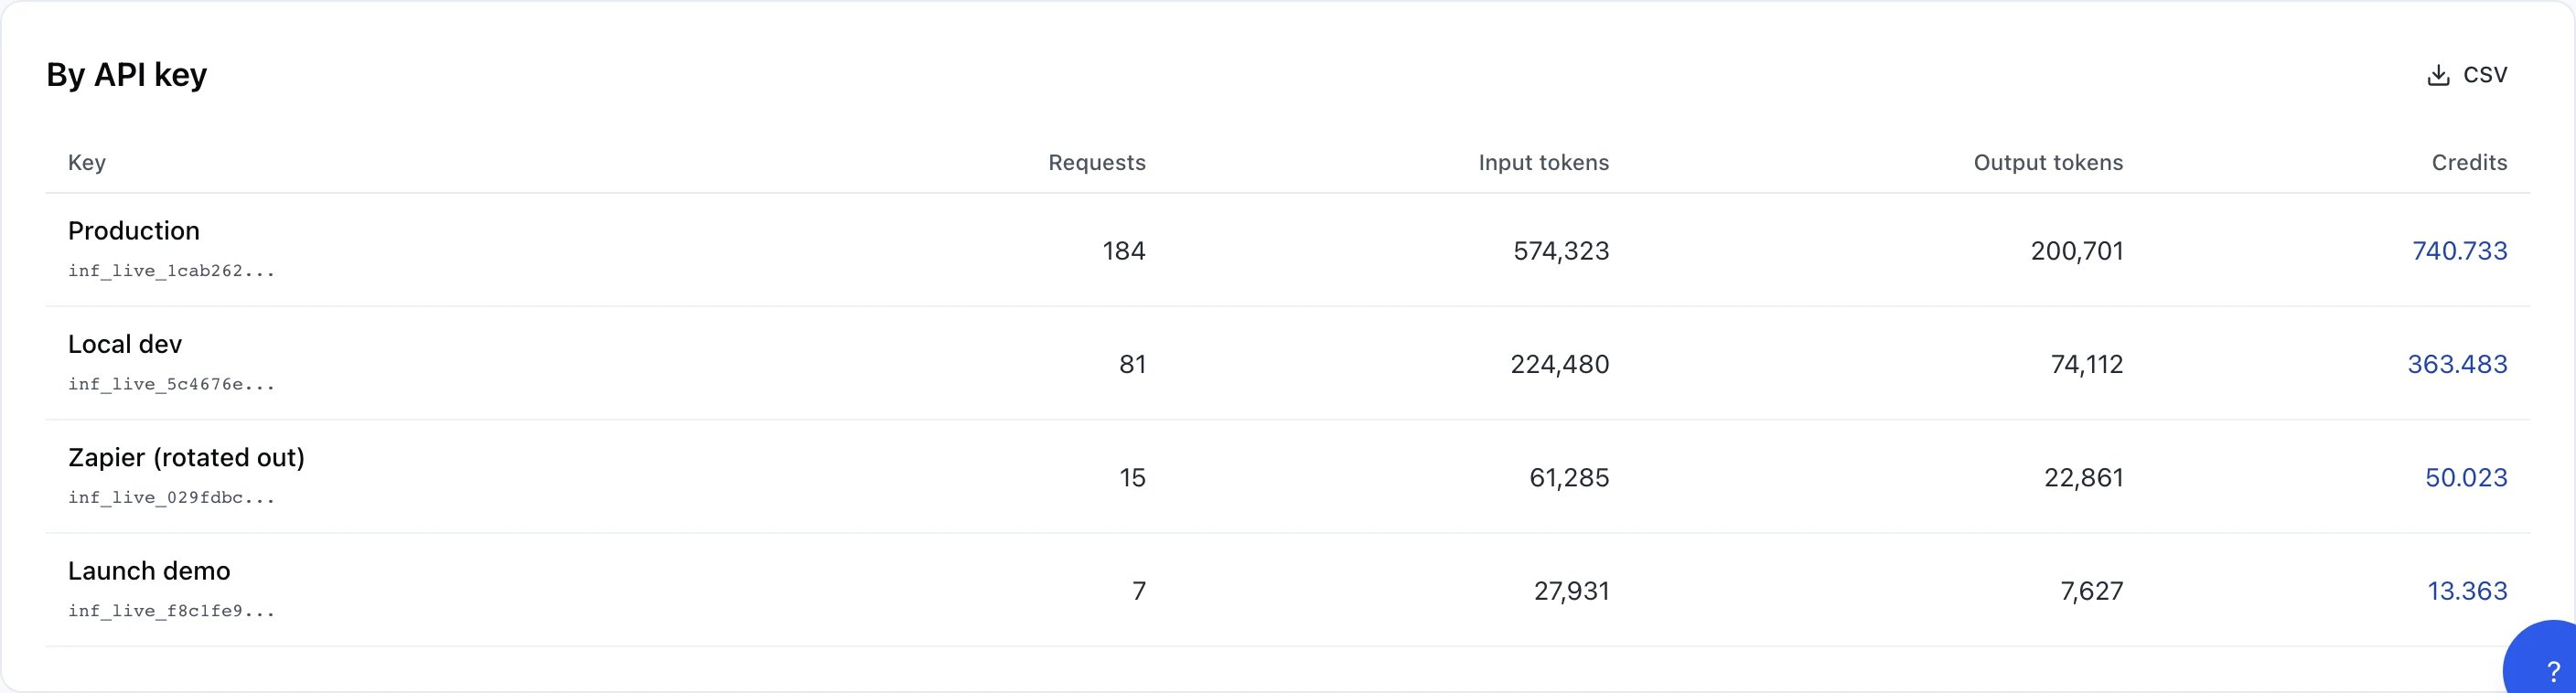
A By API key table with columns Key, Requests, Input tokens, Output tokens and Credits, listing four rows sorted with the most expensive first — Production (184 requests, 740.733 credits), Local dev (81 requests, 363.483 credits), Zapier (rotated out) (15 requests, 50.023 credits) and Launch demo (7 requests, 13.363 credits). Each row also shows the key's prefix, e.g. inf_live_1cab262... for Production.A By API key table with columns Key, Requests, Input tokens, Output tokens and Credits, listing four rows sorted with the most expensive first — Production (184 requests, 740.733 credits), Local dev (81 requests, 363.483 credits), Zapier (rotated out) (15 requests, 50.023 credits) and Launch demo (7 requests, 13.363 credits). Each row also shows the key's prefix, e.g. inf_live_1cab262... for Production.

By API key — find which integration is heaviest
The two retired keys still carry real requests and real credits from before they were rotated out or expired — a key does not stop having spent money just because it can no longer spend more.
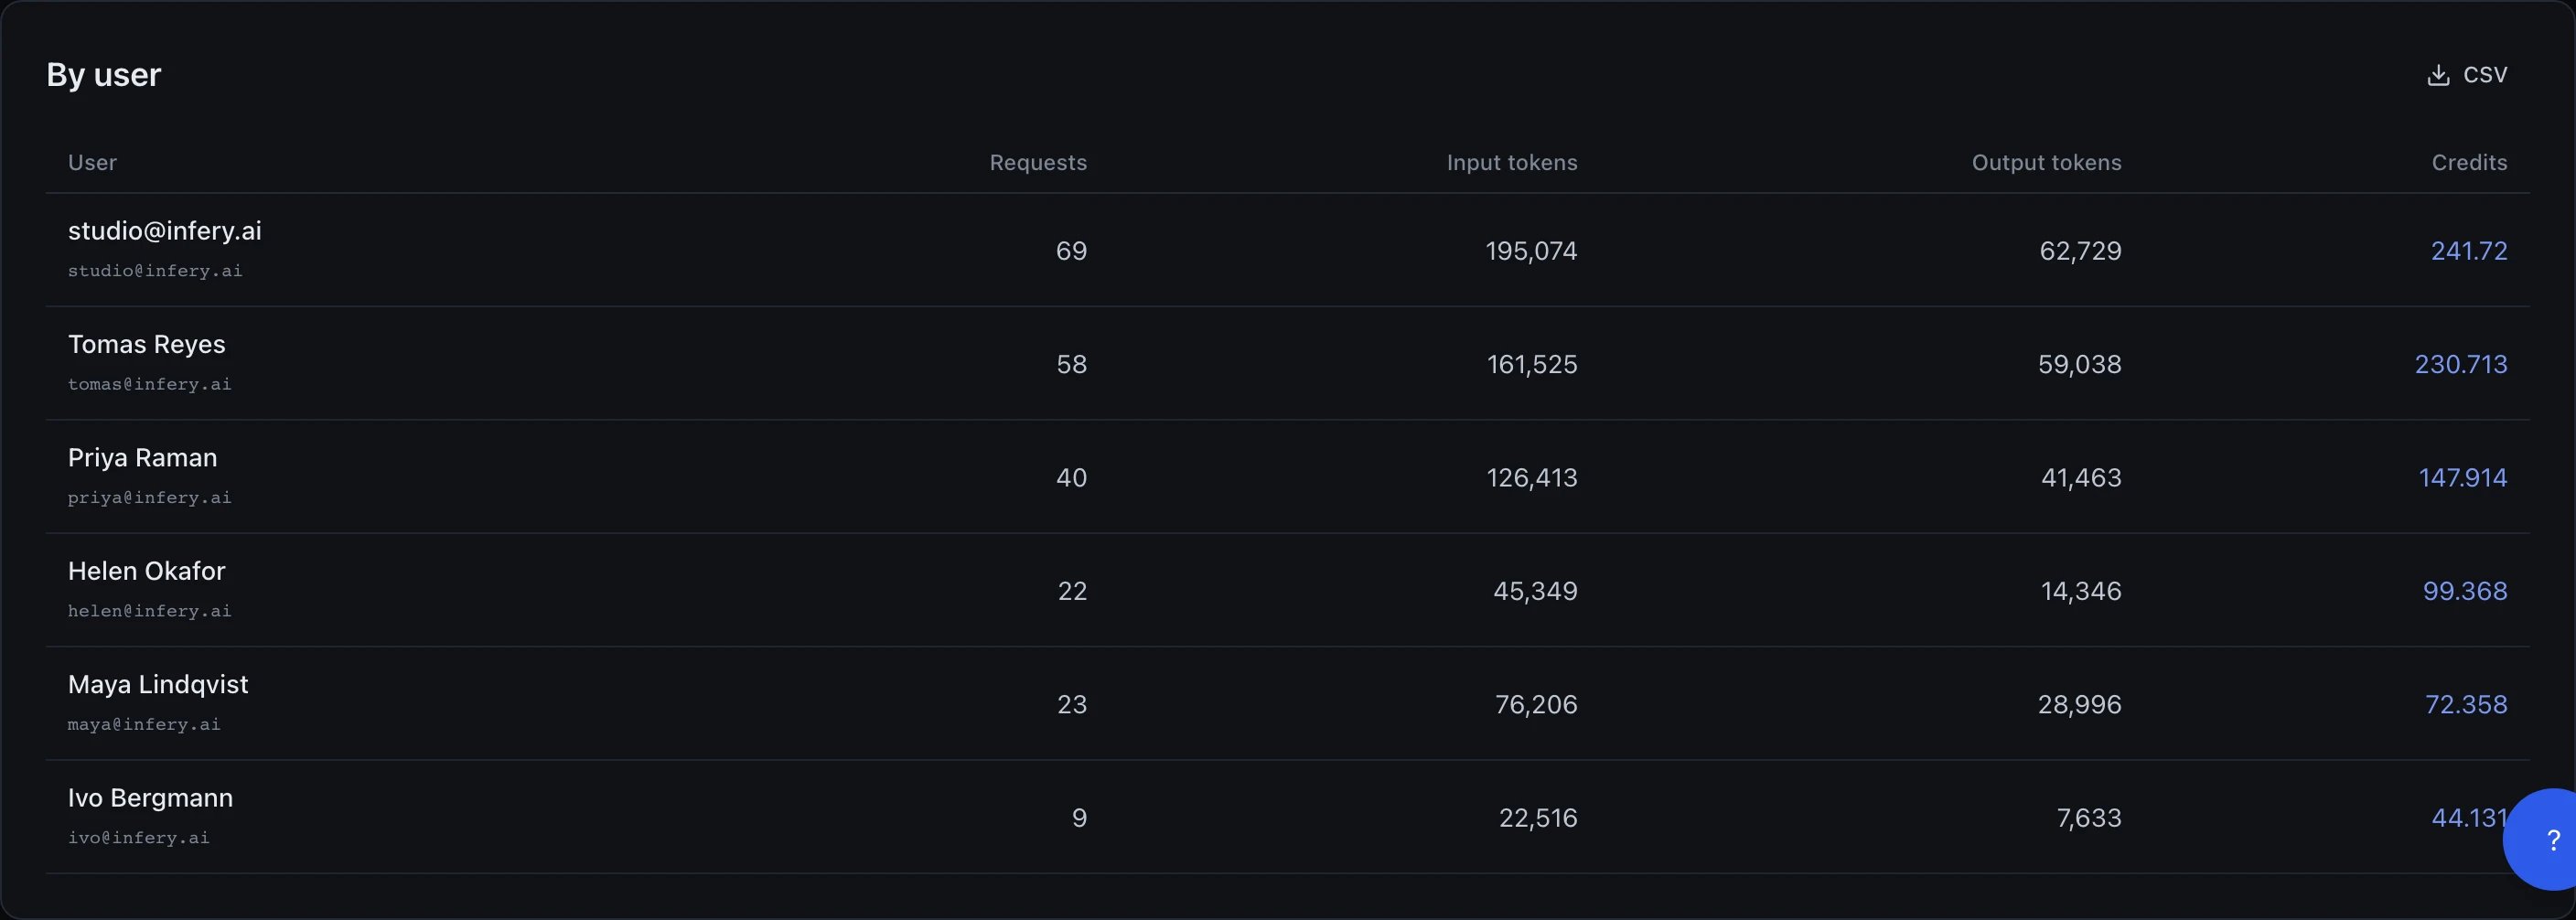
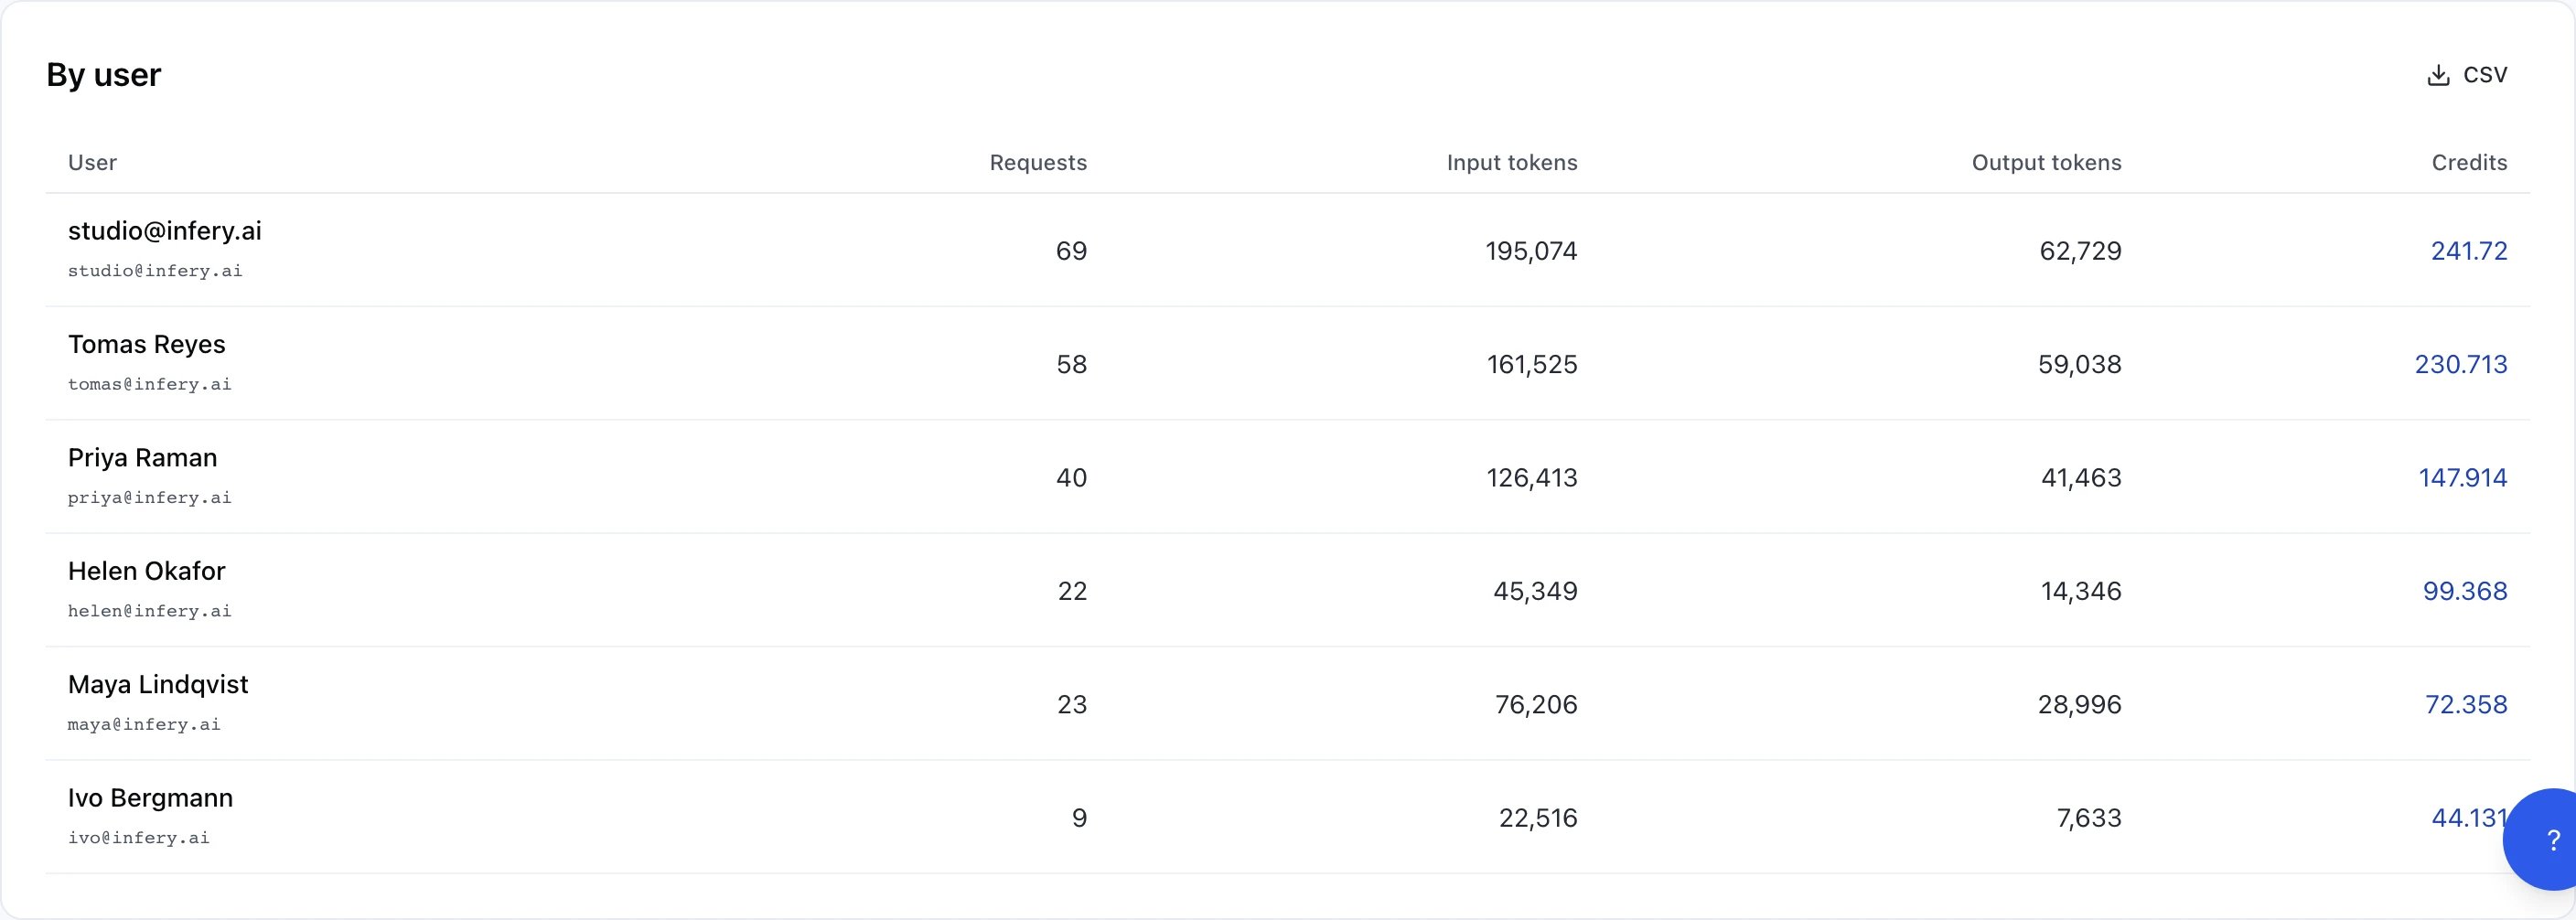
A By user table with columns User, Requests, Input tokens, Output tokens and Credits, listing six workspace members sorted with the most expensive first — studio@infery.ai (69 requests, 241.72 credits), Tomas Reyes (58 requests, 230.713 credits), Priya Raman (40 requests, 147.914 credits), Helen Okafor (22 requests, 99.368 credits), Maya Lindqvist (23 requests, 72.358 credits) and Ivo Bergmann (9 requests, 44.131 credits). Each row also shows the member's email.A By user table with columns User, Requests, Input tokens, Output tokens and Credits, listing six workspace members sorted with the most expensive first — studio@infery.ai (69 requests, 241.72 credits), Tomas Reyes (58 requests, 230.713 credits), Priya Raman (40 requests, 147.914 credits), Helen Okafor (22 requests, 99.368 credits), Maya Lindqvist (23 requests, 72.358 credits) and Ivo Bergmann (9 requests, 44.131 credits). Each row also shows the member's email.

By user — Studio-only, since an API call attributes to the key rather than the human

Requests made with an API key are attributed to the key; requests made in the Studio are attributed to the member who made them. Both panels are shown because neither is the whole picture on its own — together they account for every request in the window, key-carrying or not.
A File storage panel showing disk usage of 0 B out of 50.00 GB and a file count of 0 out of 1,000,000, each with an empty progress bar.A File storage panel showing disk usage of 0 B out of 50.00 GB and a file count of 0 out of 1,000,000, each with an empty progress bar.

File storage, which is charged separately from inference

Click any row in Recent requests to see:
  • Full timing: gateway in/out, provider in/out, total
  • Token counts (prompt_tokens, completion_tokens, total_tokens)
  • Credits used
  • Whether a fallback fired and which model actually served the call
  • Request ID — paste this into a support ticket and we find the trace instantly
Prompts and outputs are not stored on API requests by default. Studio calls keep history per retention rules.

Per-request cost in the response

Every API response includes these headers:
The cost itself comes back as a credits_used field in the JSON response body for most endpoints — not a header. The one exception is binary responses with no JSON body to carry it (text-to-speech audio), which get an x-credits-used header instead. Streaming responses carry credits_used in the final SSE chunk instead of the body:
So you can attribute cost in your own logs without polling Usage.

Exporting

CSV export: each panel (Daily, By model, By API key, By user) has its own CSV button that downloads that panel for the selected date range. API: the dashboard itself calls GET /workspaces/{workspaceId}/usage/{summary|daily|by-model|by-api-key|by-user|recent} (session-authenticated, from/to query params) — there is no /v1/usage endpoint for API keys today. For nightly ingestion into your own warehouse, pull from the CSV exports or the per-request data on your own logged responses.

Invoices

BillingHistory lists every invoice — subscription renewals and topups. Each row links to:
  • A PDF invoice (UK VAT applied where required)
  • The Stripe receipt
  • The exact credit pack delivered
Invoices are emailed to the address on file with Stripe for the workspace — there is no separate in-dashboard “billing contact” setting to edit.

Reconciling with Stripe

Each Infery invoice references a Stripe pi_... (payment intent) and in_... (invoice) id. If you reconcile via Stripe export, match on metadata.workspaceId — that’s the key Infery actually writes on checkout sessions; there is no infery_invoice_id metadata field.

Budget alerts

Set in Settings → Budget alerts: pick a credit threshold and a period (daily, weekly or monthly), and get an email when spend in that period reaches it. Catches runaway loops and leaked keys before the bill does. See Budget alerts.